Nike – Social media dashboard
Whilst contracting at AKQA I was asked to come up with a concept for a social media dashboard that could be used the Nike staff to track and analyse interactions with the company. Nike has multiple accounts that they manage and the idea for the dashboard was that they could use the vast amounts of data they gather on interactions to better target marketing campaigns and get a clearer understanding of their audience.
The dashboard would draw in data from multiple sources, including Twitter, Facebook and Instagram and would keep track of active campaigns (such as the Twitter-based #FindGreatness). The dashboard could even keep track of individual Nike+ members who would be profiled in detail and their interactions with the company tracked over time as they move from beginners to ‘leaders’ and ‘brand advocates’.
The dashboard could also be used to track interactions with Nike’s customer services team with detailed breakdown of the channels that are being used as well as which accounts are receiving the most customer service-related traffic. In addition, Nike managers would consult the dashboard to track the performance of their teams.

This is a section of the main page of the dashboard that features an attention panel for the user to check when they log in, as well as a view of the current campaigns they’re tracking. Each section would be customisable and different users could order their homepage as they wish.

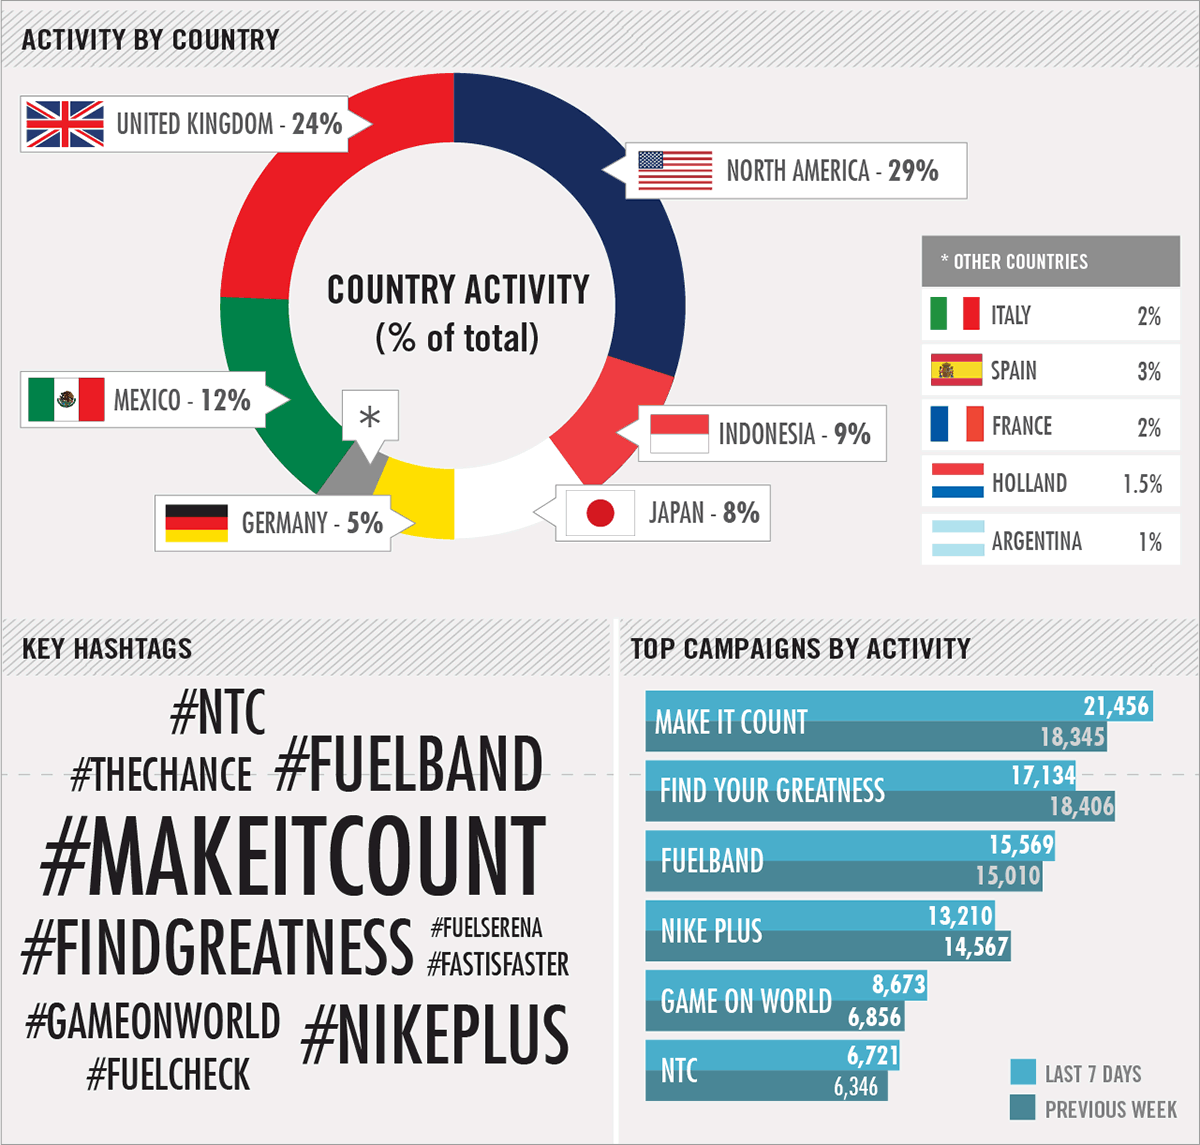
This is a section of the Twitter-focused page of the dashboard that details country location from which the activity is coming, as well as key hashtags and campaign activity.

This is part of an individual profile screen which details an engaged consumer profile, including details of their Nike+ scores as well as their profile completeness. In addition, the user can check which stages of a campaign the consumer is at.

This screen details one milestone in a social media campaign and indicates how many people are currently at this stage. The red box details the current target that has been set by the campaign manager and which the team must work towards fulfilling. The user can also check which of their tweets have been most successful and which consumer segments need attention.

This is a section of the country segment that details customer service interactions, including detailed figures with comparisons to previous weeks, plus most common topics of complaint. In addition the user can check a heat map of social media interactions filtered by specific factors, including Nike Fuel generation.

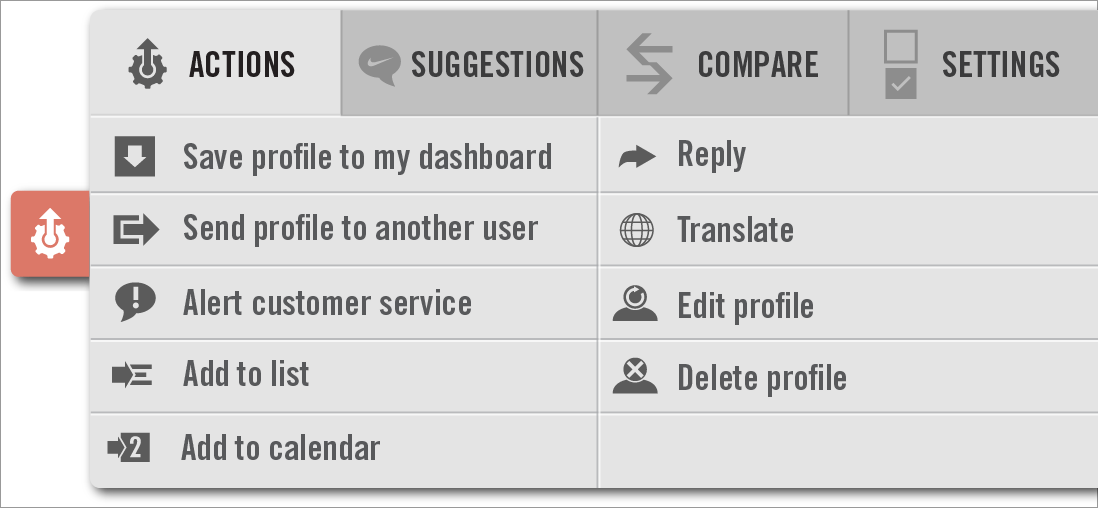
This is a detailed view of the overlay available to all users that features context-sensitive actions, as well as suggestions that could be set by team managers, a comparison tool to allow users to compare segments and general settings.
